
Every location. Every review. Every channel customers use now.
Custom Web Audits is the reputation, local-SEO, and AI-search-visibility platform built for franchises, multi-unit operators, and franchisee groups.
Per-vertical category schemas, a 12-month sentiment heatmap, store rankings, and a full website audit on every location — re-run on an ongoing cadence so site problems get caught before customers (or Google) do.
A full website audit on every store
Every company website site gets technical SEO, performance / Core Web Vitals, accessibility, content quality, and on-page health audits.
Every Store Location gets Review Sentiment across 10 different categories monthly and over time, Local AI Search Presence, and valuable location-by-location data you can't get anywhere else — all stitched into one network-wide view. History tracked so you can see store improvement over time.
See every store's performance in the places that matter most — monthly, quarterly, or across a full year
Track store-level problems as they emerge, straight from authentic customer and reviewer voices, in real time.
| Category | 25-06 | 25-07 | 25-08 | 25-09 | 25-10 | 25-11 | 25-12 | 26-01 | 26-02 | 26-03 | 26-04 | 26-05 | Overall |
|---|---|---|---|---|---|---|---|---|---|---|---|---|---|
|
Food Quality & Taste
💬 reviews
|
69 | 71 | 69 | 69 | 65 | 66 | 70 | 63 | 71 | 74 | 78 | 76 |
70
1,144 rev
|
|
Order Accuracy
💬 reviews
|
33 | 34 | 34 | 31 | 32 | 30 | 29 | 27 | 31 | 33 | 32 | 31 |
31
1,052 rev
|
|
Speed of Service
💬 reviews
|
51 | 48 | 50 | 49 | 50 | 50 | 47 | 47 | 51 | 50 | 50 | 49 |
49
1,022 rev
|
|
Staff Friendliness & Service
💬 reviews
|
64 | 65 | 65 | 61 | 60 | 59 | 60 | 59 | 60 | 63 | 64 | 65 |
62
1,258 rev
|
|
Cleanliness & Atmosphere
💬 reviews
|
59 | 63 | 59 | 56 | 55 | 55 | 55 | 61 | 60 | 55 | 64 | 76 |
61
936 rev
|
|
Value & Pricing
💬 reviews
|
32 | 37 | 34 | 39 | 33 | 35 | 38 | 30 | 33 | 39 | 42 | 47 |
36
894 rev
|
|
Online Ordering & Delivery
💬 reviews
|
35 | 32 | 34 | 30 | 30 | 30 | 26 | 26 | 27 | 23 | 21 | — |
28
794 rev
|
|
Ingredient Freshness & Portion
💬 reviews
|
43 | 44 | 43 | 47 | 45 | 41 | 39 | 39 | 43 | 40 | 46 | 53 |
44
1,024 rev
|
|
Location & Convenience
💬 reviews
|
64 | 60 | 55 | 58 | 56 | 59 | 58 | 50 | 60 | 60 | 65 | 65 |
59
813 rev
|
|
Consistency
💬 reviews
|
55 | 50 | 50 | 53 | 50 | 52 | 55 | 51 | 51 | 52 | 53 | 55 |
52
1,034 rev
|
Rank every location against every other, by any category
Pick a category, pick a time window (30, 90, or 365 days, or all time), and sort best-first or worst-first. Top performers rise to the top, worst performers stand out, and stores with insufficient data are clearly separated. Click any row to drill into that store's profile.
Track how AI platforms see your brand
Customers stopped Googling and started asking AI assistants for "best burger near me" / "coffee shop with WiFi" / "best Italian sub in town." If your brand isn't in the answer, you're invisible to a growing share of demand. We track that — across the major AI assistants, for the queries that matter.
- Per-assistant visibility breakdown
- Google AI Overview ranking
- AI keyword search-volume tracking
- Competitive scan on the same queries
- Reddit brand sentiment tracking
- YouTube brand sentiment tracking
- 25% average AI visibility
- Mentioned by AI engines but not yet in top rankings
- Neutral sentiment on ChatGPT, Perplexity — room to improve
Every review, organized around what actually matters to your business
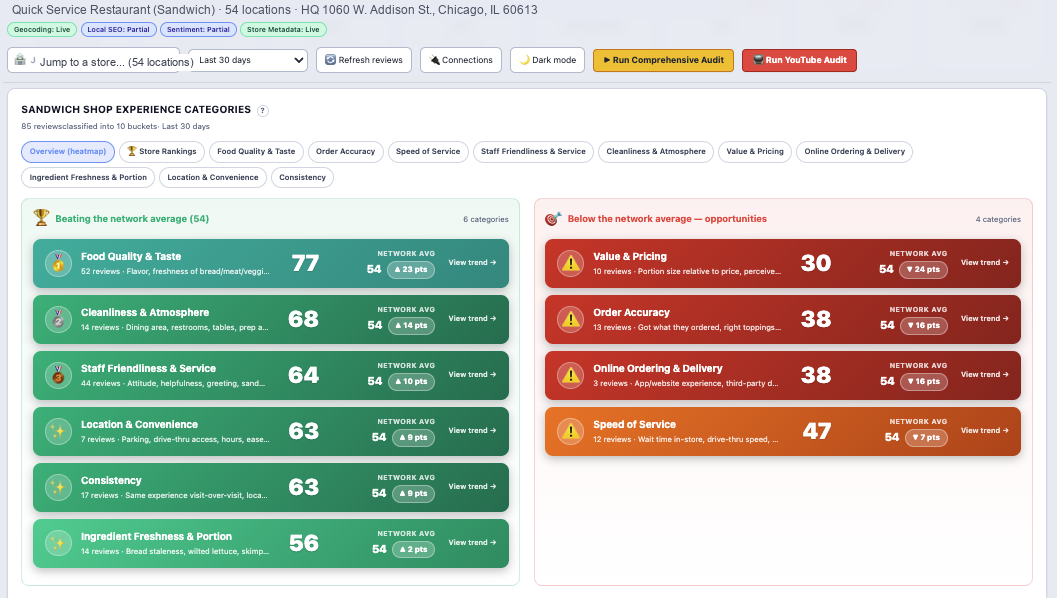
We build a 10-category review schema tailored to your vertical — coffee shops get Espresso Quality, Barista Service, Seating & Wi-Fi. QSR gets Order Accuracy, Speed of Service. Salons get Stylist Skill, Cleanliness. Every review is read by AI, scored 0–100, and bucketed into the categories that matter for your guests.
- Per-vertical schema — coffee, QSR, hotel, fitness, salon, dental, retail, more
- Side-by-side beating-average vs opportunity columns
- Network avg delta on every row so franchisees see the gap
- Filter by category, store, source, score, date range
POS integrations available as an add-on up on request
Wire your point-of-sale into your store dashboards and unlock per-store revenue, average ticket, item-level sales, and customer counts alongside the reviews, audits, and AI search visibility you already see.
One connection per franchise account covers every store under your POS — no store-by-store setup. Every integration is a paid add-on, priced by the number of locations.
Square
Coffee shops, retail, QSR. Per-location daily totals, item sales, payments, customers, loyalty.
Toast
Full-service and QSR restaurants. Orders, checks, item-level sales, labor, online ordering.
Clover
QSR, retail, salons, services. Orders, payments, items, customers, employees.
Lightspeed
Restaurant + Retail product lines. Sales, inventory, item-level reporting.
Olo
Restaurant digital-ordering aggregator. DoorDash, Uber Eats, and direct online-order data in one feed.
TouchBistro
iPad-based restaurant POS. Orders, menu-item mix, time-of-day distribution.
Revel
iPad POS for QSR, pizza, retail. Multi-store reporting, inventory, customer history.
SpotOn
Modern restaurant POS with marketing + loyalty. Per-location sales and customer reach.
Heartland
Payment processor with restaurant + retail POS. Per-store transaction and settlement data.
Aggregator routes
Omnivore, Cuboh, Otter — one wire covers long-tail POS systems when your stores aren't uniform.
How we compare to what franchises pay today
A 10-store business typically pays $7K–$18K a year for a stitched-together stack: one vendor for listings, another for reviews, a third for local-SEO audits. We bundle it, add AI search visibility, and ship at mid-band pricing.
| Feature | Custom Web Audits | Listings tools | Reputation tools | Enterprise suites |
|---|---|---|---|---|
| Full per-store website audit | ✓ Included | — | — | ◑ Add-on |
| Weekly backlinks refresh | ✓ Included | — | — | ◑ Add-on |
| Per-vertical 10-category buckets | ✓ Configurable per brand | — | ◑ Generic sentiment | ◑ Vertical-specific |
| 12-month sentiment heatmap | ✓ Per-store + network | — | ◑ Partial | ◑ Add-on |
| Store rankings by category | ✓ Sortable, time-windowed | — | — | ◑ Add-on |
| Industry benchmark per category | ✓ Built in | — | ◑ | ✓ |
| AI search visibility (multi-engine) | ✓ Included | — | — | ◑ Roadmap |
| Reddit + YouTube brand sentiment | ✓ Included | — | ◑ Mentions only | ◑ Add-on |
| All-reviews paginated browser | ✓ Filterable | — | ◑ Partial | ✓ |
| Per-store profile page | ✓ Categories + sentiment + audit | ✓ Listings-only | ✓ Reviews-only | ✓ |
Categories built for your kind of franchise
Most reputation tools give you a single star rating per location and leave you guessing. We read every review and score it across 10 categories that actually matter for your business — whether you run QSR, coffee, hotels, fitness, salons, dental groups, or retail. For each category you get a 12-month heatmap, monthly trends, store-by-store rankings, and a benchmark against your industry, so you can see exactly where each location stands and what to fix first.
Food Quality & Taste
How the food actually tastes and looks.
Order Accuracy
Got what they ordered, modifications honored.
Speed of Service
Wait times in store, drive-thru, online pickup.
Staff Friendliness
Greeting, attitude, willingness to help.
Cleanliness & Atmosphere
Dining room, restroom, prep area.
Value & Pricing
Portion size, fairness, coupon honoring.
Online Ordering & Delivery
App, third-party delivery, pickup process.
Ingredient Freshness & Portion
Crisp lettuce, fresh bread, generous portion.
Location & Convenience
Parking, hours, ease of finding.
Consistency
Same experience visit-over-visit and location-to-location.
Coffee, hotels, fitness, salons, dental, retail, and other franchise verticals have their own 10-bucket schemas. All configurable per brand.
What about Placer.ai and Tattle?
Two platforms franchise marketers often shortlist alongside us — Placer.ai (foot-traffic analytics) and Tattle (in-restaurant guest surveys) — solve adjacent problems, not the same one. Here's an honest read of where each platform sits.
Per-store website audit, public-review sentiment with per-vertical 10-category schemas, AI search visibility, store rankings, backlinks, local SEO — every location, refreshed on a schedule, white-labeled by default. Built for any multi-location vertical.
De-identified mobile-location panel data. Visit counts, dwell time, trade-area mapping, visitor demographics, chain-level trends. Strong for real-estate site selection and "how many people walked in" measurement. Doesn't touch your website, your reviews, or AI search visibility.
Restaurant-only. Sends post-transaction surveys across ordering channels, stitches feedback with POS data, scores item-level menu performance, and uses AI to draft guest-recovery replies. Powerful inside the four walls — doesn't audit your website or track AI search visibility.
| Capability | Custom Web Audits | Placer.ai | Tattle |
|---|---|---|---|
| Foot-traffic / visit counts (mobile panel) | — Not measured | ✓ Core feature | — |
| Trade area + visitor demographics | — | ✓ Core feature | — |
| First-party post-transaction surveys | — | — | ✓ Core feature |
| POS / online-ordering integration | — | — | ✓ |
| Item-level (menu) feedback | — | — | ✓ Restaurant-only |
| Per-store comprehensive website audit | ✓ 10 score categories, every store | — | — |
| Public-review sentiment (GBP + Yelp) | ✓ Per-vertical 10-category schema | — | ◑ Review aggregation, survey-led |
| 12-month sentiment heatmap | ✓ Per-store + network | — | ◑ Trend lines only |
| AI search visibility (ChatGPT / Claude / Gemini / Perplexity / Google AI Overviews) | ✓ Every major assistant included, bi-weekly refresh — no per-engine add-ons | — | — |
| Backlinks + domain authority | ✓ Weekly refresh per store | — | — |
| Local-pack rank + NAP + profile completeness | ✓ Per store | — | — |
| Store rankings by review category | ✓ Sortable, time-windowed | ◑ Visit-count rankings | ◑ Survey-score rankings |
| In-platform AI assistant | ✓ Brand-wide Q&A on every metric | — | ✓ "AI Coach" — survey-led action plans |
| Vertical coverage | Any multi-location vertical | Retail, QSR, CRE, fitness, & more | Restaurants only |
Simple, per-store pricing
Same full feature set at every tier — per-store pricing scales with your network, from $60/store/mo. Book a demo for a quote tailored to your locations.
- Reviews + sentiment + per-vertical category buckets
- Listings + monthly trend chart
- Daily review refresh
- AI search visibility across major AI assistants (bi-weekly)
- Reddit + YouTube brand sentiment tracking
- Per-category panels + store rankings
- Weekly competitive scan + backlinks
- Weekly comprehensive website audit per store
- Reviews + sentiment + per-vertical category buckets
- Listings + monthly trend chart
- Daily review refresh
- AI search visibility across major AI assistants (bi-weekly)
- Reddit + YouTube brand sentiment tracking
- Per-category panels + store rankings
- Weekly competitive scan + backlinks
- Weekly comprehensive website audit per store
- Reviews + sentiment + per-vertical category buckets
- Listings + monthly trend chart
- Daily review refresh
- AI search visibility across major AI assistants (bi-weekly)
- Reddit + YouTube brand sentiment tracking
- Per-category panels + store rankings
- Weekly competitive scan + backlinks
- Weekly comprehensive website audit per store
- Custom Citation Building by location
- POS Integrations
See it in action
Schedule a demo and we'll walk you through the platform, show you how it works for your vertical, and answer your questions. Learn how it would look across your locations — book a time that works for you.